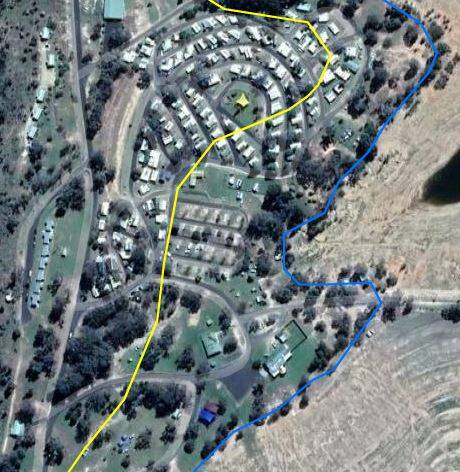
New mapping of the Wyangala Dam expansion shows possible changes to the maximum water levels and the potential land loss in the Upper Lachlan Shire.
Subscribe now for unlimited access.
$0/
(min cost $0)
or signup to continue reading
Weddin Mapping Solutions has published the map online.
The creator, using a digital elevation model from Geoscience, identified contours of the existing maximum water level and plotted the new contours before fitting out the map with imagery and roads.
It shows the existing dam covers 5435 hectares.
Raising the dam wall by 10 metres would increase the area of inundation to 7343ha or by 35 per cent.
The map is not official, however it is based on the idea of raising the dam wall, to which the state government committed during the election.
If it went to 110-120pc, to the surge level, more than half of our freehold land would disappear.
- Sean Proudman
In June last year, the state budget allowed for $32 million over three years to investigate the dam augmentation.
It is a part of a $650 million project to ensure water security and flood management in the Lachlan Valley.
It also supports irrigated agriculture in Cowra, Forbes, Condobolin and Hillston, while in August last year Orange City Council said a pipeline proposed between Carcoar and Cowra would benefit from water released from Wyangala Dam.
Landowners, Grabine Lakeside State Park, Reflections Holiday Park, Grabine Road and the Bigga Fishing Club hut on Foggs Crossing Road would all be threatened by a new high water level if the mapping is accurate.
Sean Proudman took high water level readings at his property in Grabine.
"We'd lose a lot of our freehold land as well as the permissive occupancy land," Mr Proudman said.
"If it went to 110-120pc, to the surge level, more than half of our freehold land would disappear."
The passing of the Water Supply (Critical Needs) Bill 2019 in the NSW Parliament late last year is expected to speed up work.
The temporary legislation creates a streamlined pathway through the assessment and approvals process.
The map showing the possible new levels can be viewed at: weddinmappingsolutions.com.au/wyangala-dam-upgrade/
DO YOU WANT MORE ORANGE NEWS?
- Receive our free newsletters delivered to your inbox, as well as breaking news alerts. Sign up below ...


